Abundance via point-transect distance-sampling (point counts) when detection does not depends on covariates.
Loading required package: units
udunits database from C:/Users/trent/AppData/Local/R/win-library/4.5/units/share/udunits/udunits2.xml
# Example data
data("thrasherDetectionData")  # access example data
data("thrasherSiteData")
head(thrasherDetectionData)  # inspect example data
  siteID groupsize    dist
1  C1X01         1  11 [m]
2  C1X01         1 183 [m]
3  C1X02         1  58 [m]
4  C1X04         1  89 [m]
5  C1X05         1  83 [m]
6  C1X06         1  95 [m]
  siteID observer bare herb shrub height npoints
1  C1X01     obs5 45.8 19.5  18.7   23.7       1
2  C1X02     obs5 43.4 20.2  20.0   23.6       1
3  C1X03     obs5 44.1 18.8  19.4   23.7       1
4  C1X04     obs5 38.3 22.5  23.5   34.3       1
5  C1X05     obs5 41.5 20.5  20.6   26.8       1
6  C1X06     obs5 43.7 18.6  20.0   23.8       1
# Make nested data frame required by Rdistance
thrasherDf <- RdistDf(thrasherSiteData
                      , thrasherDetectionData
                      , by = "siteID"
                      , pointSurvey = TRUE
                      , observer = "single"
                      , .detectionCol = "detections"
                      , .effortCol = "npoints")
head(thrasherDf)
# A tibble: 6 × 8
# Rowwise:  siteID
  siteID         detections observer  bare  herb shrub height npoints
  <fct>  <list<tibble[,2]>> <fct>    <dbl> <dbl> <dbl>  <dbl>   <dbl>
1 C1X01             [2 × 2] obs5      45.8  19.5  18.7   23.7       1
2 C1X02             [1 × 2] obs5      43.4  20.2  20     23.6       1
3 C1X04             [1 × 2] obs5      38.3  22.5  23.5   34.3       1
4 C1X05             [1 × 2] obs5      41.5  20.5  20.6   26.8       1
5 C1X06             [1 × 2] obs5      43.7  18.6  20     23.8       1
6 C1X08             [1 × 2] obs5      41.5  20.1  20.9   29.4       1
summary(thrasherDf, formula = dist ~ groupsize(groupsize))
Transect type: point
Effort:
       Transects: 120
    Total length: 120 [points]
Distances:
   0 [m] to 265 [m]: 193
Sightings:
         Groups: 193
    Individuals: 196
oneHectare <- units::set_units(1, "ha")

dfuncFit <- thrasherDf |>
  dfuncEstim(dist ~ groupsize(groupsize)
             , likelihood = "hazrate") |>
  abundEstim(area = oneHectare
             , ci = NULL)

summary(dfuncFit)
Call: dfuncEstim(data = thrasherDf, dist ~ groupsize(groupsize),
likelihood = "hazrate")
Coefficients:
Estimate SE z p(>|z|)
(Intercept) 4.540434 0.06265929 72.46226 0.000000e+00
k 4.199565 0.39721233 10.57259 3.992942e-26
Message: Success; Asymptotic SE's
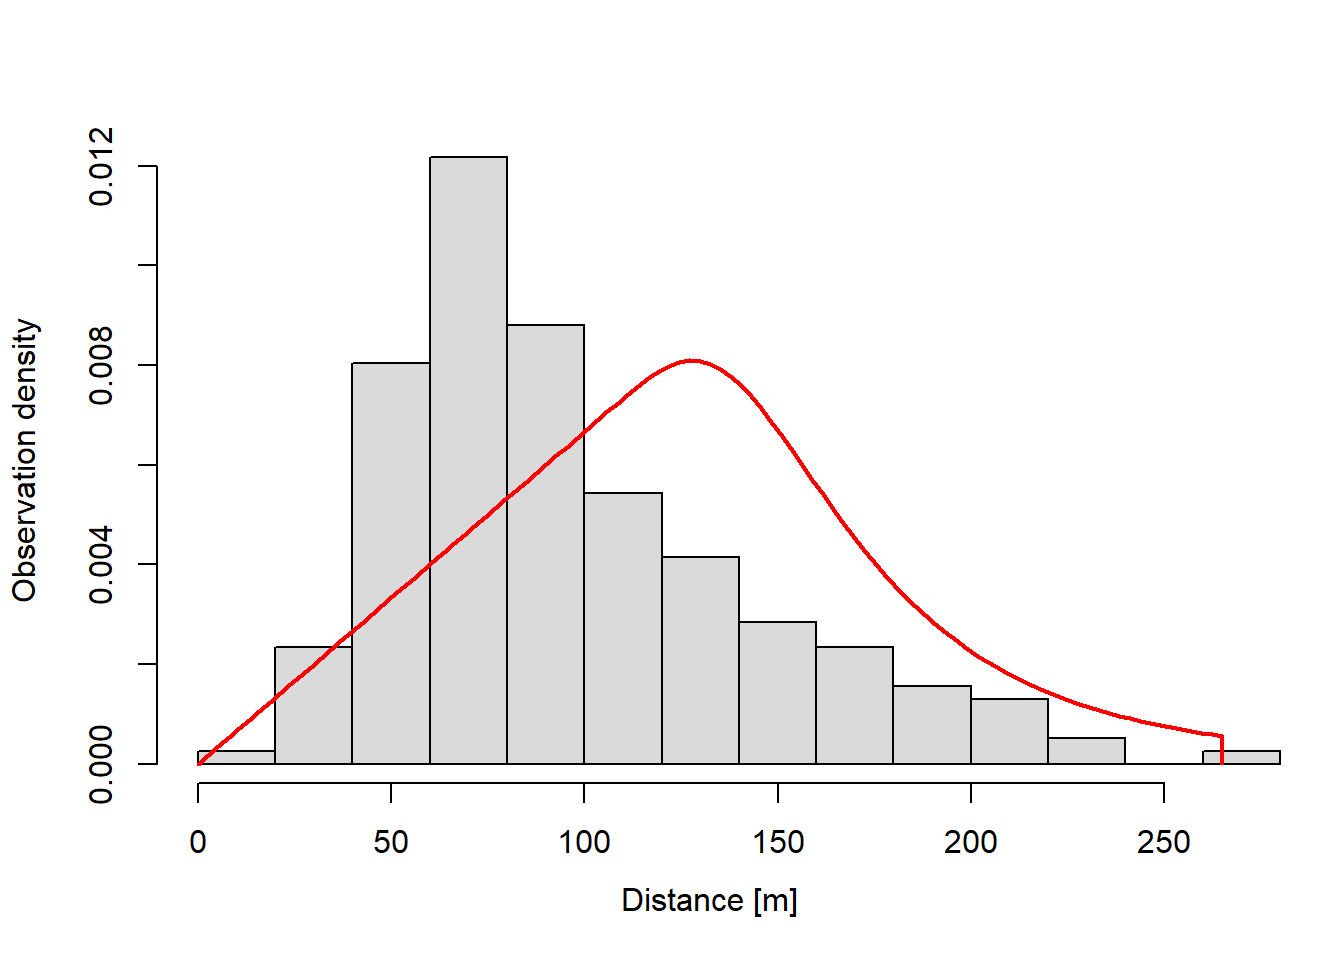
Function: HAZRATE
Strip: 0 [m] to 265 [m]
Effective detection radius (EDR): 118.6254 [m]
Probability of detection: 0.2003842
Scaling: g(0 [m]) = 1
Log likelihood: -999.0241
AICc: 2002.111
Surveyed Units: 120
Individuals seen: 196 in 193 groups
Average group size: 1.015544
Group size range: 1 to 2
Density in sampled area: 3.694619e-05 [1/m^2]
Abundance in 10000 [m^2] study area: 0.3694619
plot(dfuncFit
     , nbins = 15)