In this post, I demonstrate how to estimate a distance function using Rdistance.
Estimation
Rdistance (version 3.0.0)
data (sparrowDetectionData)<- dfuncEstim ( dist ~ 1 detectionData = sparrowDetectionDatalikelihood = "halfnorm" )
Call: dfuncEstim(formula = dist ~ 1, detectionData =
   sparrowDetectionData, likelihood = "halfnorm")
Coefficients:
       Estimate  SE       z         p(>|z|)
Sigma  52.39612  1.97278  26.55954  1.992907e-155

Convergence: Success
Function: HALFNORM
Strip: 0 [m] to 207 [m]
Effective strip width (ESW): 65.66368 [m]
Probability of detection: 0.3172158
Scaling: g(0 [m]) = 1
Negative log likelihood: 1667.639
AICc: 3337.289
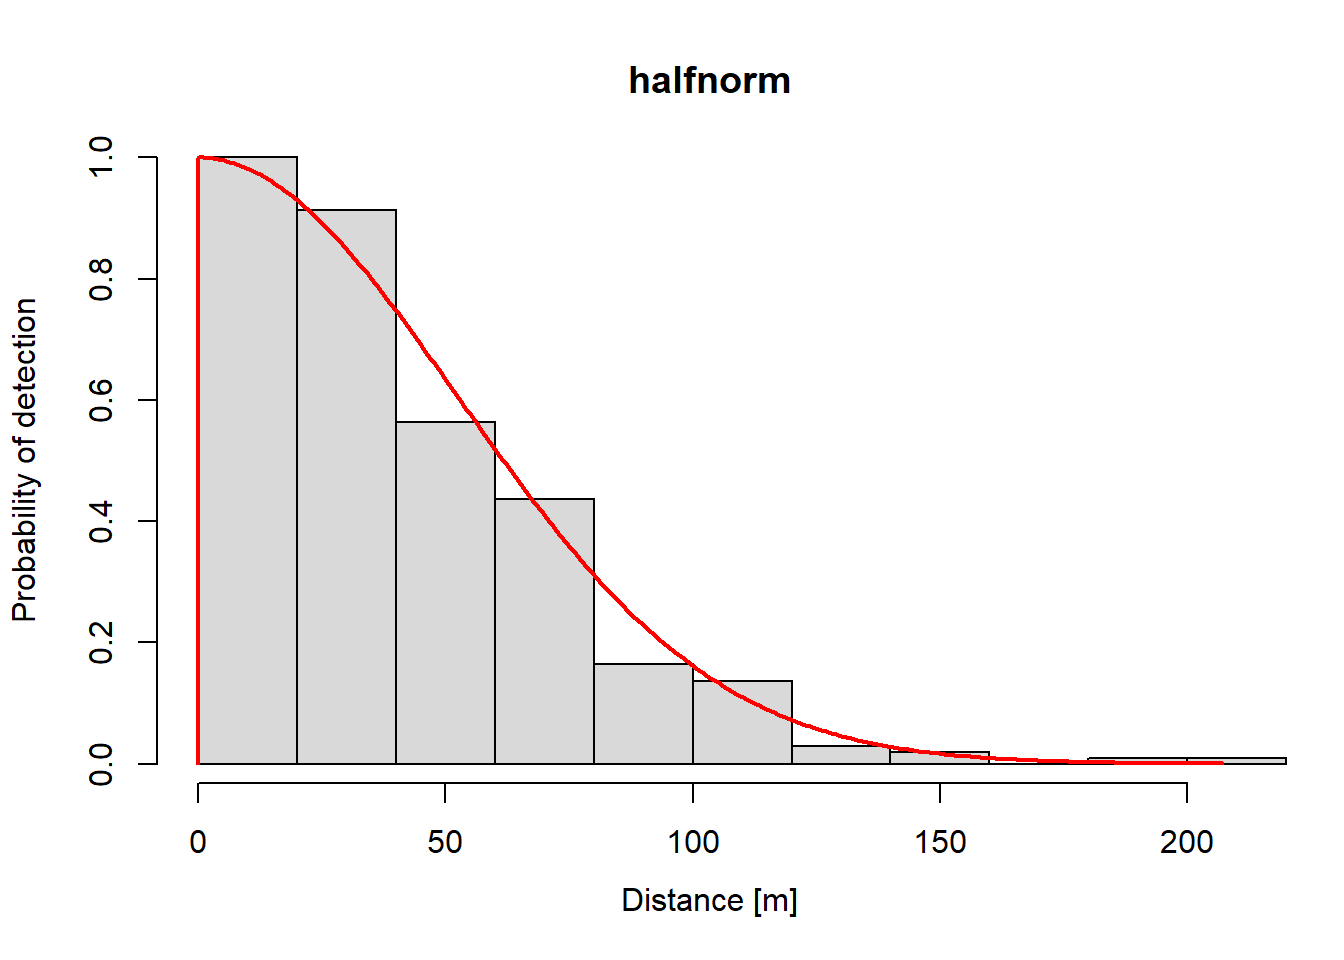
The dfunc output shows parameter estimates, convergence status, and effective strip width (i.e., 65.6637).
Plots
Plots of the estimated function are easy.
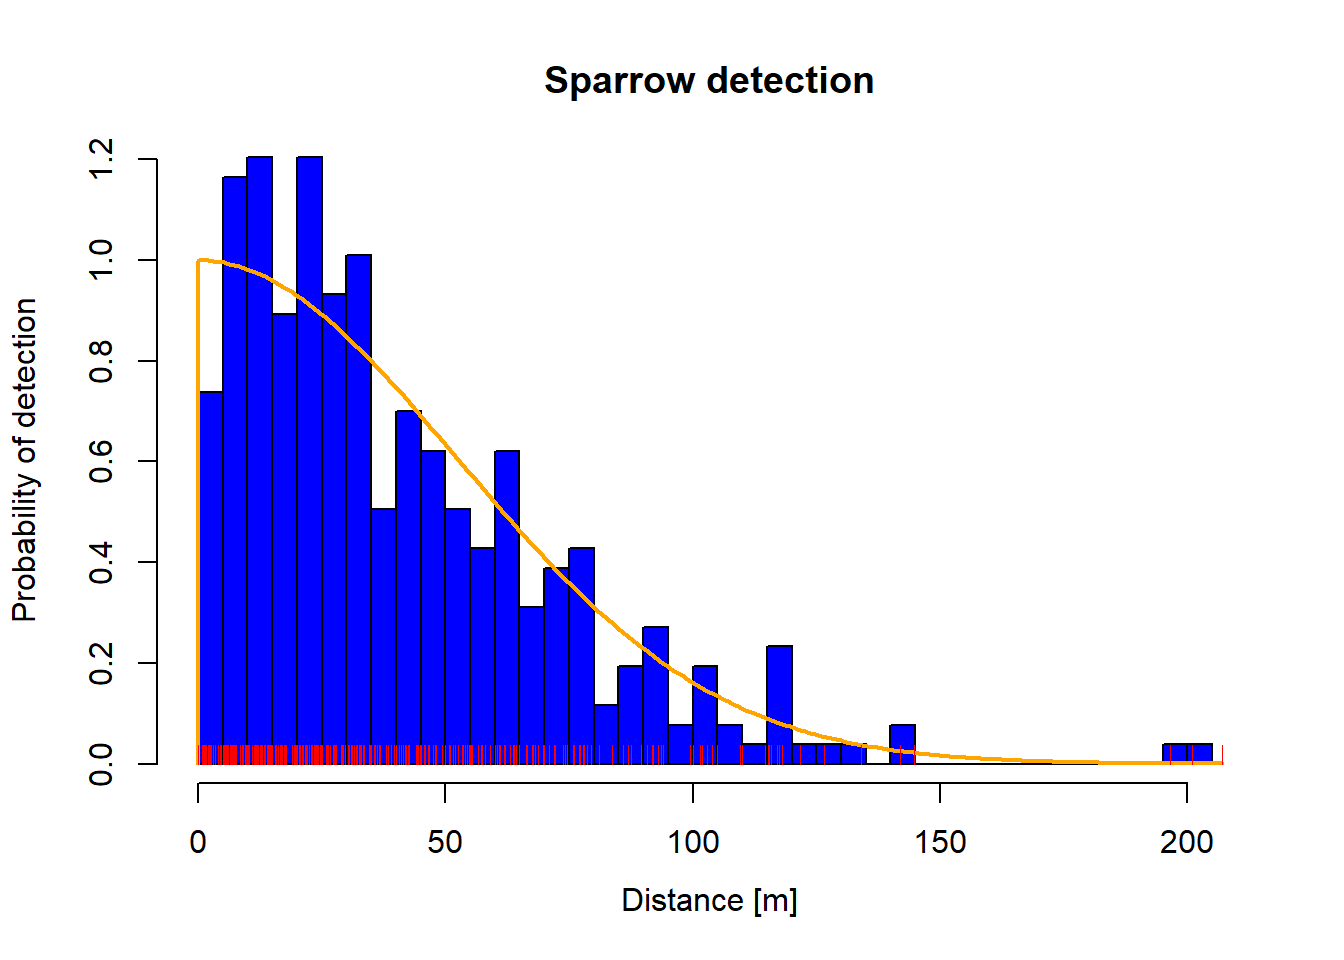
The plot can be customized in a number of ways. For example, we can change the number of bars, color the bars, and the titles.
plot (dfuncnbins = 40 col = "blue" density = - 1 col.dfunc = "orange" main = "Sparrow detection" )rug (dfunc$ detections$ dist, col= "red" )
Abundance Estimates
Information on the transects (i.e., number and length of each) is contained in the sparrowSiteData data frame.
data ("sparrowSiteData" )head (sparrowSiteData)
  siteID  length observer bare herb shrub height shrubclass
1     A1 500 [m]     obs4 36.7 15.9  20.1   26.4       High
2     A2 500 [m]     obs4 38.7 16.1  19.3   25.0       High
3     A3 500 [m]     obs5 37.7 18.8  19.8   27.0       High
4     A4 500 [m]     obs5 37.7 17.9  19.9   27.1       High
5     B1 500 [m]     obs3 58.5 17.6   5.2   19.6        Low
6     B2 500 [m]     obs3 56.6 18.1   5.2   19.0        Low
Let’s assume the study area on which these transects were collected was 300 ha. Estimates of sparrow density on the sampled transects and sparrow abundance in the study area are obtained by calling the abundEstim function with an estimate distance function, transect data frame, and study area size. Measurement units must be applied to study area size so that Rdistance computes density correctly. By default, Rdistance computes 95% confidence intervals by bootstrap resampling individual transects in the transect information data frame. Setting showProgress to FALSE shuts off the progress bar. Outside of markup documents, the bootstrap progress bar can improve sanity of the analyst.
<- abundEstim (dfuncdetectionData = sparrowDetectionDatasiteData = sparrowSiteDataarea = units:: set_units (300 , "ha" )showProgress = FALSE )
Call: dfuncEstim(formula = dist ~ 1, detectionData =
   sparrowDetectionData, likelihood = "halfnorm")
Coefficients:
       Estimate  SE       z         p(>|z|)
Sigma  52.39612  1.97278  26.55954  1.992907e-155

Convergence: Success
Function: HALFNORM
Strip: 0 [m] to 207 [m]
Effective strip width (ESW): 65.66368 [m]
                     95% CI: 59.20046 [m] to 72.86502 [m]
Probability of detection: 0.3172158
Scaling: g(0 [m]) = 1
Negative log likelihood: 1667.639
AICc: 3337.289

     Surveyed Units: 36000 [m]
   Individuals seen: 356 in 356 groups
 Average group size: 1
              Range: 1 to 1

Density in sampled area: 7.529953e-05 [1/m^2]
                 95% CI: 5.823606e-05 [1/m^2] to 9.392443e-05 [1/m^2]

Abundance in 3e+06 [m^2] study area: 225.8986
                             95% CI: 174.7082 to 281.7733
Density and abundance estimates along with boostrap confidence intervals appear below the distance function we’ve already seen.